How Alpine School District is Failing More Kids Every Year
Sign the Petition
to rid us of Investigations Math & Associated Programs
About a month ago I was engaged in a series of emails with Barry Graff, Alpine School District's curriculum specialist. During that exchange, Barry mentioned this:
"My views may or may not be the views of particular board members. I think their bottom line will be student achievement data - are we worse off because of using Investigations? Right now, the data would not support that view - including our most recent CRT data."
At the time I didn't think much of that statement but last week I decided to look up the CRT's since I really didn't know much about them or the district's scores on those exams.
The CRT's are a statewide test to measure the level of mathematical proficiency in a student. The four levels are defined as follows:
4: Substantial Mastery
3: Sufficient Mastery
2: Partial Mastery
1: Minimal Mastery
What these P.C. terms really mean is Level 1 students are failing and Level 2 students aren't up to par.
I downloaded the CRT scores from the state for the years 2001-2004 from the state website http://www.usoe.k12.ut.us/eval/Results.asp. Then I tossed them into a spreadsheet, carefully shook them up, added a garnish, and out popped the below graphs. Very tasty.
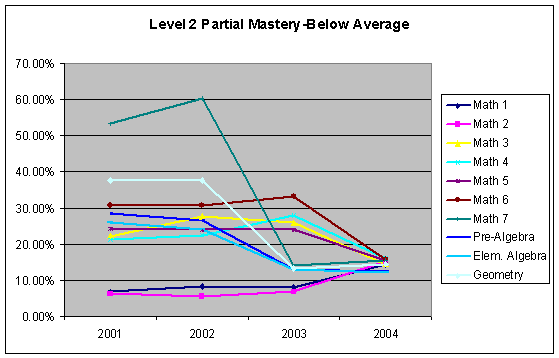
As can be seen on this first graph, under Investigations Math, Connected Math, and Interactive Math, Alpine School District is increasing the proportion of students that are failing every year for four years running. I'll get to an analysis of what these scores mean as well as individual grade levels in just a moment. If you are one of the people in favor of these math programs, ponder for just a few seconds, what possible other explanations you could come up with to explain this graph. If you get a good one, please contact me and let me know. All I can see is four years ago only 1-5% of the district was at level 1 mastery in all grade levels. Now the minimum grade level has around 7% of the student population failing and the maximum class failing rate is about 43% of the population of the students. This isn't just a particular school, this is 54,000 STUDENTS IN THE ENTIRE DISTRICT AVERAGED. Pitiful and if I may use a stronger word, damning. Embarrassing just doesn't cut it here. I have started examining other schools and districts and some portray similar patterns to what ASD shows and I will do a more full comparison when time permits. However, charter schools have extraordinary performance compared to the public schools (for a variety of reasons) and they tend to have next to no students in level 1 and even level 2. Most are in the highest levels of math mastery.

I presented all of these graphs to the school board on November 8, 2005. Each board member and a couple of the district personnel received a packet including all the data and the graphs as well as a terrific article below. If you are interested, you may download a copy of the Excel spreadsheet which contains the data by clicking this link: Alpine School District CRT Scores.
Also at the meeting, the board took time to read a statement which they have provided me and I will link to it below. For now, here's the rest of the graphs.


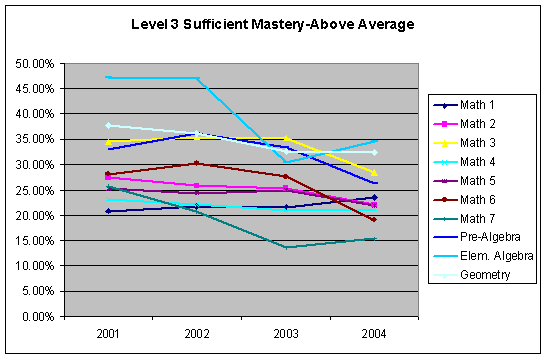
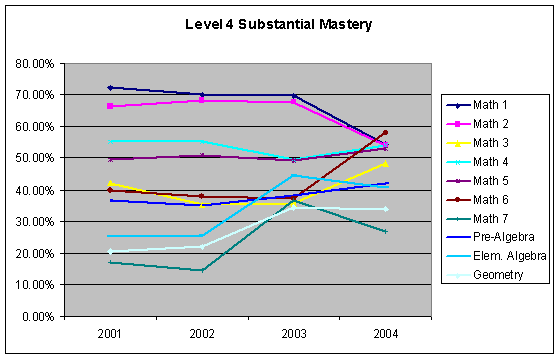
As the above graphs show, only Level 1 scores are consistently moving in the same direction...that of failing our children.
Now I will present the levels by class along with comments to the sides of some of them.
FACTS:
In almost every case above, levels 3 and 4 have trends nearly exactly opposite each other and levels 1 and 2 have trends nearly opposite each other.
In almost every case the trends are for levels 2 and 3 to decline and levels 1 and 4 to go up.
In every case level 1 (the lowest level of mastery--ie. failing) goes up. Every year we are increasing the number of students that fail math.
SUPPOSITION:
If the mark of success in a math program is for a shifting up in scores at the lowest level, representing the students struggling most with the subject, this district has failed us as every single grade level has large increases to level 1 mastery (failing).
THEORY:
Since SES factors are the number 1 indicator of academic performance, I will draw a generalization that may not be entirely accurate, but I will simply assume that those children in levels 1 and 2 are in the lower half of the SES spectrum of the district, while those in the level 3 and 4 mastery levels are in the upper end of the spectrum.
I am also going to assume that a factor in the higher SES home is that parents are more involved and may be better able to monitor and do something about their child's education than those in lower SES homes who may have additional financial burdens and obligations that take the place of time they would like to spend monitoring their children's education.
Parents that can afford to do so are supplementing their child's education, either internally (homeschooling & supplementing) or externally (tutoring) to give their children a solid education.
Parents of children in level 3 and 4 mastery are the higher SES parents and are quite frustrated with this math program. They see the lack of content in the program and are supplementing or having their child tutored to make up for the current shallow curriculum. This supplementing causes a rise in the education for levels 3 and 4 and thus the number of 3's generally declines and 4's generally increase, not due to the curriculum, but due to parental involvement in supplementing education.
Parents of children in levels 1 and 2 mastery are either unaware of what is happening to their children (through lower education themselves or through a lack of time or a lack of interest), or be unable to do anything due to their lower SES status so they find their children slipping from level 2 mastery to level 1 over the last 5 years of being subjected to a substandard curriculum where teachers no longer teach the things that would be taught in a rigorous program.
CONCLUSION:
A program that causes harm to the lowest SES group in a population, is not an effective program and in fact hurts even more the ability of the lower SES children to break out of the lower SES lifestyle. The subject of math is critical to high paying jobs that utilize technology. Math is a language all its own. It deals with its own symbols and terminology in the same way that another language like Spanish or German has its own peculiar grammar. We should not attempt to convert math to the English language, but should teach it as it belongs, in its own language, taught by it's own grammar structures (algorithms) and proper memorization of translated words (facts).
Investigations, Connected, and Interactive math are punishing the lower SES segments of our district that cannot escape their economic condition and cannot supplement their children's education the same way the upper SES segments are doing for their children. These programs should be immediately replaced with something that establishes a proper foundation in the language of math for all children of all SES categories.
CALIFORNIA STUDY
After going through the information above at the board meeting, I responded to something the board had put in their statement about no single curriculum that ensures success for every student. Their statement can be read from the link at the bottom, but unfortunately for them, I had another study to share.
Wayne Bishop is a Ph D in the Department of Mathematics from Cal State in L.A. A couple years ago he wrote a paper that studied the effect of one single change in California schools after the state legislature banned constructivist math programs from California. The program in use at that time was Mathland and was virtually identical to Investigations math in the removal of things like teaching the times tables, long division, etc... Dr. Bishop's study focused on one single curricula that was used in many locations around California districts to replace Mathland. That single curriculum was Saxon Math.
In this paper on Saxon math's tremendous grade improvements over Mathland, you'll find a dozen or so examples of grade improvements which happened at both low SES schools as well as high SES schools. Every single school saw enormous improvements and the conclusion of the author is that 30 years of increasing funding and constructivist math programs didn't do a thing for math education, but in 5 years grades at schools went up 20-200% after one single change to Saxon math. That's right, some of the poorest minority schools were in the 20th percentile and in 5 years of Saxon math hit the 60th percentile...3 times the performance. Remarkable and just the opposite of the trends we see in Alpine School District. Please open the article and read it. (Saxon math is a Silver Bullet-----"Hi-yo Saxon...Awayyyyyyyy"---sorry, hard to get the proper inflection for the Lone Ranger)
Here is the school board statement: ALPINE SCHOOL BOARD STATEMENT (click to open)
Sign the Petition
to rid us of Investigations Math & Associated Programs
Investigations Math Menu
** Most important pages to read (all have value but if you will only read
a few pages make it these)
* Very important
|