|
Home
Investigations Math Section
*Weekly Math Updates*
Weapons of Math Destruction Comics
17th Amendment
 Summer
Adult Soccer Summer
Adult Soccer
Political Ramblings
There Goes the Neighborhood
(AKA "Track Two")
Where Have All The Prophets Gone?
Great Quotes
Founding Fathers
--Christian Nation
Other Political Quotes
Shocking Quotes
Inspirational Quotes
Origin of the Name Oak
Other Articles and Talks
Reviews
Humor (to me at least)
Free Software
Projects
Utahns Against Common Core

Scavenger Hunt Clues & Treasure Hunt Ideas

Outdoor Survival Gear

Math Comics

Utah's Republic - Restoring Constitutional Education

Meet Some Mormons
|
Amber Lee's Independent Research
Oak,
After attending Math Night orientations for Investigations in the Fall of 2001, I couldn’t wait for my 3rd grader to get started. Since then, I have gradually become more and more dissatisfied with the results of the program for my children who are now in grades 8, 5, 4, and 1 in Alpine School District. Many of my neighbors also are dissatisfied with the Investigations program. But I have often wondered how the math situation looks outside my personal view which is based on my own family’s subjective experience. So reading K12 Administrator Barry Graff’s “wow" statement in the Daily Herald (http://www.heraldextra.com/content/view/191394/) regarding Alpine School District’s state math test scores, really perked my curiosity about how ASD scores rate compared to others in the state, nation and world.
The first place I looked for a ‘wow’ was at the state level. I visited http://u-pass.schools.utah.gov/u-passweb/, but I was unable to access the reports because of internet difficulties. So I looked at my child’s 3rd grade UPASS report for spring 2005. The percent correct of total points possible were comparable or nearly identical for students in the school district compared to students statewide in the math areas tested:
Number Sense – District 85; State 84
Algebra – District 87; State 87
Geometry – District 80; State 81
Measurement – District 81; State 81
Data & Probability – District 91; State 91
Procedural – District 86; State 85
Conceptual – District 81; State 81
Problem Solving – District 86; State 85
I wish I had access to all the grades and all the years. I did look at some of my other children’s reports for other grades and years. The pattern seemed to me to be that the district’s average scores were very similar to the state’s average scores. It is good news that as a district we have not fallen below state average, but this did not ‘wow’ me.
Next I looked to the national rankings for a ‘wow’. I wondered if perhaps Utah State and Alpine School District scores exceeded national averages. I visited the website http://nces.ed.gov/nationsreportcard/ for the National Center for Educational Progress (NCEP) otherwise known as “the Nation’s Report Card”
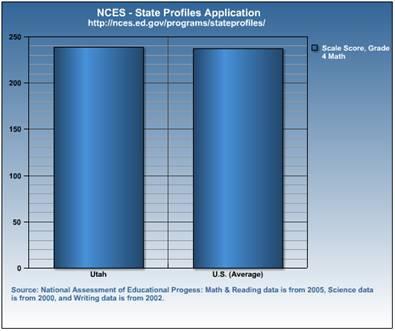
In 2005, the most recent year for which math results are available, 4th graders in Utah schools scored 239 compared to the national average of 237 and Utah 8th graders scored 279 compared to the national average of 278. It appears we are doing a good job here, but nothing here suggests to me a ‘wow’.
In my final quest for a ‘wow’. I looked to international math performance. Perhaps Alpine School District scores on standardized test are exceptional when compared to those in other developed countries. The best information I could find on the international picture was from a study released in November 2005.
“The study, conducted by the American Institutes for Research (AIR) under funding provided by the U.S. Department of Education, reexamined data from three international surveys assessing mathematics achievement in 2003 – the Trends in International Mathematics and Science Study (TIMSS), which assessed students in grades 4 and 8, and the Program for International Student Assessment (PISA), which assessed 15-year-olds, most of whom were in 10th grade.
The study, “Reassessing U.S. International Mathematics Performance: New Findings from the 2003 TIMSS and PISA,” focused on students in the United States and 11 other industrial countries that participated in all three assessments: Australia, Belgium, Hong Kong, Hungary, Italy, Japan, Latvia, Netherlands, New Zealand, Norway, and the Russian Federation.”
U.S. students consistently performed below average, ranking 8th or 9th out of twelve at all three grade levels.”
http://www.air.org/news/documents/Release200511math.htm
Clearly international math performance ranking failed to give me the feel good ‘wow’ I was looking for.
I realize the local student scoring data I have access to is necessarily incomplete. I don’t know how Alpine School District math scores compared to State math scores before the new math programs were implemented. And there are other factors and variables involved. For example, extra instructional help from parents may be raising the student averages in our area. However, general impression I got from my brief searching is that Alpine School District student’s math scores are average for the state and nation while failing internationally. I am looking forward to results of the latest District test scores which will available to the public on Sept 15th and perhaps I will then understand what Mr. Graff was referring to when he said "Our student achievement data is really -- all I can say is wow."
Amber Lee
Investigations Math Menu
** Most important pages to read (all have value but if you will only read
a few pages make it these)
* Very important
|